The State of the Game
Last Week 5/9 Season Total 142/207
STATE OF THE GAME
In the end the score was 142 from 207 matches. This is a success rate of about 68.6%. I was aiming for at least 70%, close, but I think I took a few risks in the last few rounds that didn’t pay off. And, while that score was reasonable high, it wasn’t enough for me to win any of the competitions I was in. How did you fair? Were my tips helpful anyway? Probably not.
The race has been run for 10 teams now and those supporters are now just wishing the finals would hurry up and be over. But I ask you to spare a thought for your mates that still have teams live in the finals and give them the recognition and kudos that their team has earned for the year. Best practice is to politely say, “Get Stuffed, <insert derogatory name here>.” This usually conveys the appropriate level of warmth and friendship that such a feat calls for.
Next week I’ll cover the finals preview but this week I can talk about the state of the game.
Every year I track the results of the game and compare them so we can understand how the constant tinkering of the rules is advancing our game to be a better sport than the year before. The constant tinkering results from nostalgic people thinking the game used to be better before and it got a bit shit for a while and so we needed to implement rules like 6-6-6 and “STAND” to make it better to watch. If you ask most people when the pinnacle of the sport was, they mostly come back with the 90’s. Sure, this was probably true with the likes of Dunstall, Ablett and Lockett kicking 10+ goals, not on occasion, but weekly. But then coaches started zone defence and other nefarious tactics to drag the game down to such low depths that, a bit like a black hole, nothing could escape.
This year saw the return of the hard tagger which has not been sighted in these parts for a few years. From a spectator’s point of view, I’d probably prefer it if they were not part of the game and we let the good players be good and dazzle us with their exceptional skills. But, if I was a coach, and in the business of winning, I’d tag the crap of any half- decent player. It was clear that Simon Goodwin was not a fan of the hard tag and used some most excellent passive aggressive language to illustrate that point.
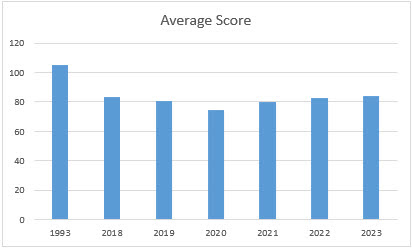
So, let’s have a look at the analysis points to evaluate how the game has been going. We’ll start by looking at the average scores and how they compare to 1993.
As you can see, average scores have improved (note, 2020 scores were adjusted as quarters were shortened due to Covid measures. Even after adjustment, the scores were generally lower). So, scores have remained fairly steady at about 80 points per team over the past 6 years despite any rule changes. The feeling is that 6-6-6 and STAND have really opened up the game, but maybe this is not the case. I’ll admit, picking 1993 is no fluke, but it was chosen as the pinnacle of games and it so happens that year, Dunstall (123), Ablett (124) and Modra (129) all kicked a lot of goals. Maybe the problem is that players were just more accurate then. Nope. In 1993 the season total was 4,782 goals and 3,552 behinds so a goal rate of 57.3%. In 2023 the tally was 5,035 goals and 3,496 behinds which is an accuracy rate of 59.0%. Wait a minute, we scored 33,706 points in 2023 versus 32,244 points in 1993. How can the averages have gone down? Well, in 1993 we had 15 teams and 20 rounds and now we have 18 teams with 23 rounds so perhaps this dilution is the real cause of lower scores. Now you know the average score was 81.4 points per team per match you can use the ‘Points For’ column in the ladder to evaluate your team. For instance, West Coast only scored 61.6 points per game, but allowed their opponents to score 116.3 points per game. At the other end of the ladder, Collingwood scored 93.1 points per game and only allowed their opponents to score 73.3 points on average. How did your team do compared to average? I have resisted showing you the histogram of scores. It’s a bit boring and shows that teams generally score about the same amounts all year…with a few exceptions.
Now
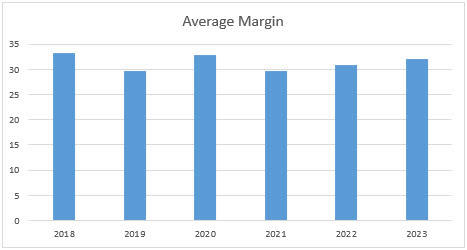
let’s take a look at the Average Margin over time. Surely games have been getting more exciting
because games have been getting closer?
Drilling down into the data even further and this up and down phenomenon is mostly due to home ground advantage as one week certain teams have it and the next week they don’t. But you can also see that some seasons are better than others.
How
about a bit of help with those margins.
If you like a bet and you like to put some money on games based on the
“Line” which is essentially betting whether the game is decided under or over a
certain margin, here is a histogram of margins for the year.
The Margin values on the X-Axis are limits so the value of 6 means games decided by more than zero point up to and including 6 points. 35 games were decided by a goal or less. As you can see most game are decided by between 0 and 5 goals. In fact, 60% of all games are decided by 30 points or less. Food for thought next time you’re having a punt.
For
the upcoming finals series, the statistical leviathan has plotted the team’s
success for each of their matches throughout the year and adjusted their
performance based on factors such as weather, ground played, players in/out and
the fixture to determine which teams are better than others. In the chart below Green means they performed
well and Red means they performed poorly.
Light Green was an exceptional performance, Dark Green a relatively good
performance given their opposition and ground and personnel, etc. Light Red performed admirably but their
performance was as expected given the opposition and Dark Red was a very poor
performance given the opposition and home ground, etc (Orange are the byes or draws).
The interesting notes here are that
The
relative positions indicate which teams should win according to the statistical
leviathan. So, Collingwood should win it
all, perhaps up against Melbourne who will fight their way back to the big
dance. But I will add the following
grain of salt for which to take that tip with…the statistical leviathan has a
terrible record of predicting with accuracy.
Good
luck if your team is in the finals and if your team is not, may they do well in
the Draft.


Comments
Post a Comment